|
| | Visualizer2 (const char *filename_) |
| | Constructor. More...
|
| |
| void | addHeaderLine (const char *s) |
| | Add a header line to the visualization. More...
|
| |
| void | addObject (const Circle2 &circ, const Color &c) |
| | Add a Circle2 object to the visualization. More...
|
| |
| void | addObject (const Edge2 &edge, const Color &c) |
| | Add an Edge2 object to the visualization. More...
|
| |
| void | addObject (const Label &lab, const Color &c) |
| | Add a Label object to the visualization. More...
|
| |
| void | addObject (const Point2 &pnt, const Color &c) |
| | Add a Point2 object to the visualization. More...
|
| |
| void | addObject (const PShape &polygonalShape, const Color &c) |
| | Add a polygonal shape. More...
|
| |
| void | addObject (const Segment2 &seg, const Color &c) |
| | Add a Segment2 object to the visualization. More...
|
| |
| void | addObject (const std::vector< ConstraintSegment2 * > &vConstraintSegments, const Color &c) |
| | Add a vector of ConstraintSegment2 pointers to the visualization. More...
|
| |
| void | addObject (const std::vector< Edge2 > &vSegments, const Color &c) |
| | Add a vector of Edge2 objects to the visualization. More...
|
| |
| void | addObject (const std::vector< Point2 * > &vPoints, const Color &c) |
| | Add a vector of Point2 pointers to the visualization. More...
|
| |
| void | addObject (const std::vector< Point2 > &vPoints, const Color &c) |
| | Add a vector of Point2 objects to the visualization. More...
|
| |
| void | addObject (const std::vector< PShape > &vPolygonalShapes, const Color &c) |
| | Add polygonal shapes. More...
|
| |
| void | addObject (const std::vector< Segment2 > &vSegments, const Color &c) |
| | Add a vector of Segment2 objects to the visualization. More...
|
| |
| void | addObject (const std::vector< Triangle2 * > &vT, const Color &c) |
| | Add a vector of Triangle2 pointers to the visualization. More...
|
| |
| void | addObject (const std::vector< Triangle2 > &vT, const Color &c) |
| | Add a vector of Triangle2 objects to the visualization. More...
|
| |
| void | addObject (const std::vector< VoroCell2 * > &vC, const Color &c) |
| | Add a vector of Voronoi Cells to the visualization. More...
|
| |
| void | addObject (const Triangle2 &tri, const Color &c) |
| | Add a Triangle2 object to the visualization. More...
|
| |
| void | addObject (ConstraintGraph2 *pCG, const Color &c) |
| | Add a ConstraintGraph2 object to the visualization. More...
|
| |
| void | addObject (VoroCell2 *pVoroCell, const Color &c) |
| | Add a Voronoi cell to the visualization. More...
|
| |
| Bbox2 | computeRange (bool bWithVoronoi) |
| | Compute the range. More...
|
| |
| void | writeFile () |
| | Finish and write the output file. More...
|
| |
|
|
| Visualizer2 (const Visualizer2 &) |
| |
|
void | changeColor (const Color &c) |
| |
|
void | changeColor (float r, float g, float b, float linewidth, bool bFill) |
| |
|
Visualizer2 & | operator= (const Visualizer2 &) |
| |
|
void | periodicStroke () |
| |
|
double | scaledDouble (const double &d) |
| |
|
Point2 | scaledPoint (const Point2 &p) |
| |
|
void | writeCircle (const Point2 &p1_, double radius, bool bFill) |
| |
|
void | writeFooter () |
| |
|
void | writeHeader (const char *title) |
| |
|
void | writeHeaderLines () |
| |
|
void | writeLabel (Label l) |
| |
|
void | writeLine (const Point2 &pSource, const Point2 &pTarget) |
| |
|
void | writeMark (const Point2 &p1_, float size) |
| |
|
void | writePoint (const Point2 &p1_, float size) |
| |
|
void | writePolygon (PShape &pshape, bool bFill, double width) |
| |
|
void | writeTriangle (const Point2 &p0_, const Point2 &p1_, const Point2 &p2_, bool bFill, double width) |
| |
|
void | writeTriangle (const Triangle2 *pT, bool bFill_, double width) |
| |
|
void | writeVoroCell (VoroCell2 *pVoroCell, bool bFill, double width) |
| |
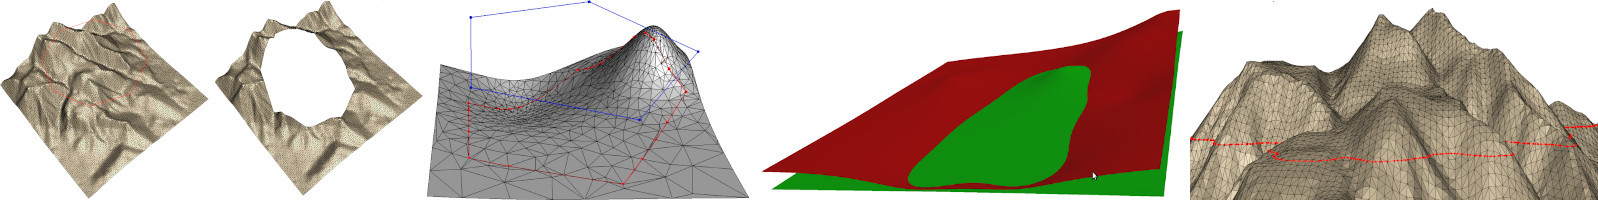
Visualizer2 is a PDF- and Postscript writer.
- See also
- http://www.geom.at/example2-traversing/
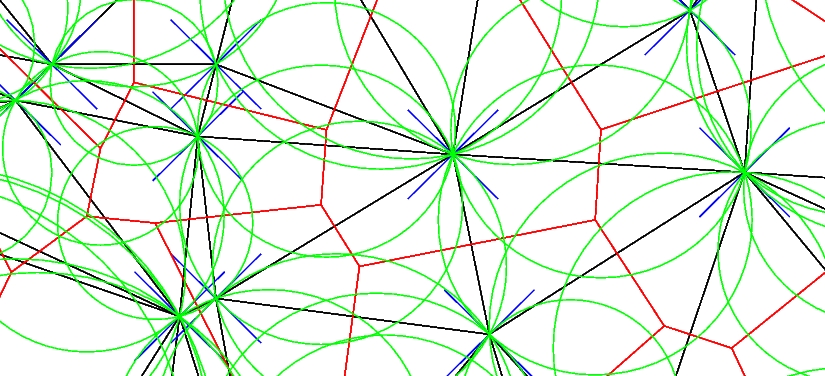
Example output of the Visualizer