When coding geometry software, numerical errors and unexpected geometric settings occur frequently. Thus, automated software testing with random geometric data is essential. But, for instance, creating random polygons without self-intersection is not trivial. Therefore the module testDataGenerators is provided to create repeatable sequences of random geometric objects for software testing and debugging. These include random surfaces, random polygons or random segments. Moreover, generators for circles and polylines from sine functions exist.
Repeatable Randomness
What you most likely require is repeatable randomness to facilitate the regeneration of test data that caused your software to crash. To achieve this, all random object generators require a seed value for static initialization of the internal random number generator. This means that a specific seed value will always produce the same sequence of objects. However, if you pass the special seed value 0, each call will result in a different generated sequence. Typically, in your testing process, you might use a loop like this:
for(int seed=1;seed<1000000;++seed)
{
	vector<...> vRandomObjects;
	generateRandom...(..,..,..,vRandomObjects,seed);
	bool bOK=mySoftware(vRandomObjects);
	if(!bOK)
	{
		cout<<"Error, seed="<<seed<<endl;
		exit(1);
	}
}
Random numbers
The code below creates two sequences of random numbers for seeds 0, 1 and 2. As mentioned above, the sequences for seed 0 differ, while those for non-zero seeds are reproducible.
size_t num(5);
double min(-100.0);
double max(100.0);

for(int seed=0;seed<3;++seed)
{
	cout<<"seed "<<seed<<": "<<endl;
	vector<double> vRandomNumbers0;
	vector<double> vRandomNumbers1;
	generateRandomNumbers(num,min,max,vRandomNumbers0,seed);
	generateRandomNumbers(num,min,max,vRandomNumbers1,seed);

	for(size_t i=0;i<vRandomNumbers0.size();++i)
	{
		cout<<vRandomNumbers0[i]<<" ";
	}
	for(size_t i=0;i<vRandomNumbers1.size();++i)
	{
		cout<<vRandomNumbers1[i]<<" ";
	}
}
seed 0:

67.6368 -81.1831 24.9494 -74.8083 34.5807

67.9391 37.8979 74.0638 89.8681 -35.0061
seed 1:

68.0375 -21.1234 56.6198 59.688 82.3295

68.0375 -21.1234 56.6198 59.688 82.3295
seed 2:

40.1953 61.9353 -82.2409 -75.7042 -30.3386

40.1953 61.9353 -82.2409 -75.7042 -30.3386
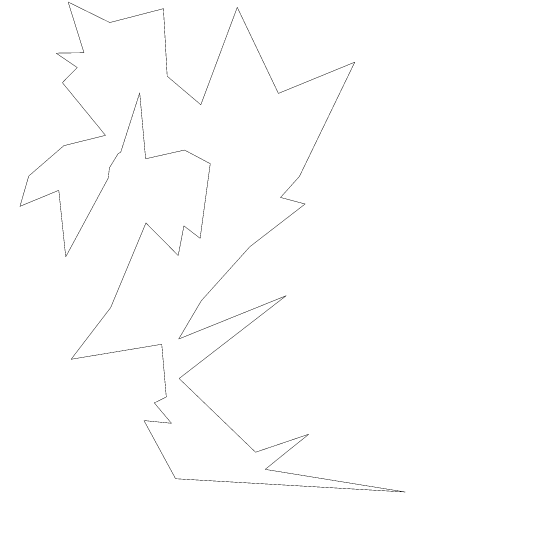
Generating Random Polygons Without Self-Intersections
The process of creating and visualizing a random simple polygon is straightforward. You select the number of segments, specify the minimum and maximum coordinates, and you’re ready to proceed. For implementation details, see the below source code snippet.
void randomPolygon()
{
	size_t num(50);
	double min(-100.0);
	double max(100.0);
	int seed(0); // seed=0 for real randomness

	vector<Segment2> vRandomPolygon;
	generateRandomPolygon(num,min,max,vRandomPolygon,seed);
	Visualizer2 vis("rndPolygon.ps");
	vis.addObject(vRandomPolygon,Color(CBLACK));
	vis.writeFile();
}
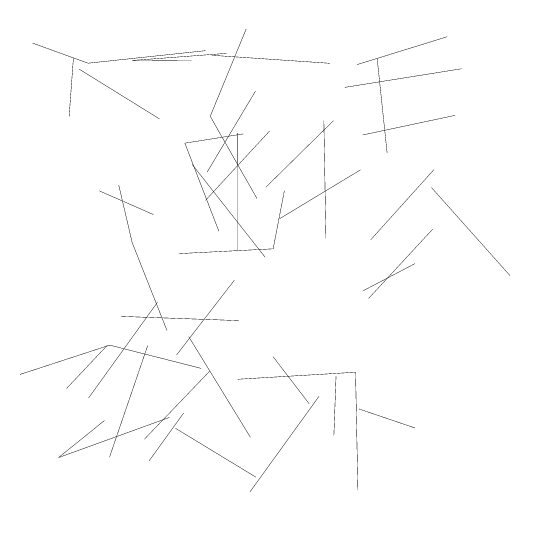
Generating Random segments
The following code generates random segments, some of which may intersect each other.
void randomSegments()
{
size_t num(50);
double min(-100.0);
double max(100.0);
double maxLen(50);
int seed(0);// seed=0 for real randomness
vector<Segment2> vRandomSegments;
generateRandomSegments(num,min,max,maxLen,vRandomSegments,seed);
Visualizer2 vis("rndSegments.ps");
vis.addObject(vRandomSegments,Color(CBLACK));
vis.writeFile();
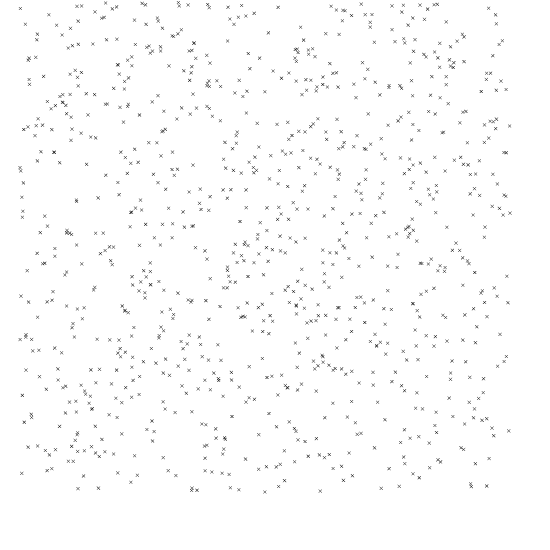
}Generating Random points
The following code creates random points within a defined bounding box.
void randomPoints()
{
  size_t num(1000);
  double min(-100.0);
  double max(100.0);
  int seed(0); // seed=0 for real randomness

  vector<Point2> vRandomPoints;
  generateRandomPoints(num,min,max,vRandomPoints,seed);
  Visualizer2 vis("rndPoints.ps");
  vis.addObject(vRandomPoints,Color(CBLACK));
  vis.writeFile();
}
Generating Circles
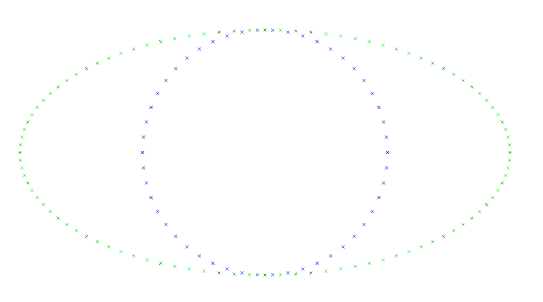
The generateCircle(...) command creates points on a specified circle. Unlike the commands discussed above, this one doesn’t involve randomness. The following code creates points on two circles, with one being scaled in x-direction. See the image.
void circles()
{
int numPoints(50);
double centerX(0.0);
double centerY(0.0);
double radiusX(1.0);
double radiusY(1.0);
vector<Point2> vCirclePoints0;
vector<Point2> vCirclePoints1;
generateCircle(numPoints,centerX,centerY,radiusX,radiusY,vCirclePoints0);
generateCircle(2*numPoints,centerX,centerY,2*radiusX,radiusY,vCirclePoints1);
Visualizer2 vis("circles.ps");
vis.addObject(vCirclePoints0,Color(CBLUE));
vis.addObject(vCirclePoints1,Color(CGREEN));
vis.writeFile();
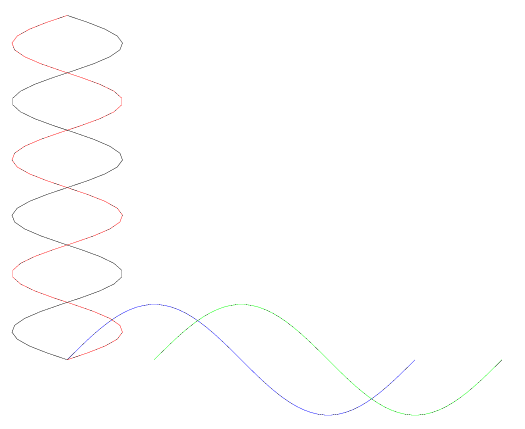
}Sine functions
This example generates four curves. It uses the base function sin(x), but allows you to swap x and y and apply independent offsets and scale factors in both the x- and y-directions.
void sineFunctions()
{
int numSegments(50);
int numPeriods(1);
double xOffset(0);
double yOffset(0);
double xFactor(1.0);
double yFactor(1.0);
bool bSwapXY(false);
vector<Segment2> vSineSegments0;
vector<Segment2> vSineSegments1;
vector<Segment2> vSineSegments2;
vector<Segment2> vSineSegments3;
generateSineSegments(numSegments,numPeriods,xOffset,yOffset,xFactor,yFactor,bSwapXY,vSineSegments0);
generateSineSegments(numSegments,numPeriods,3.14159/2.0,yOffset,xFactor,yFactor,bSwapXY,vSineSegments1);
generateSineSegments(numSegments,3,xOffset,yOffset,.33,yFactor,true,vSineSegments2);
generateSineSegments(numSegments,3,xOffset,yOffset,.33,-yFactor,true,vSineSegments3);
Visualizer2 vis("sine.ps");
vis.addObject(vSineSegments0,Color(CBLUE));
vis.addObject(vSineSegments1,Color(CGREEN));
vis.addObject(vSineSegments2,Color(CRED));
vis.addObject(vSineSegments3,Color(CBLACK));
vis.writeFile();
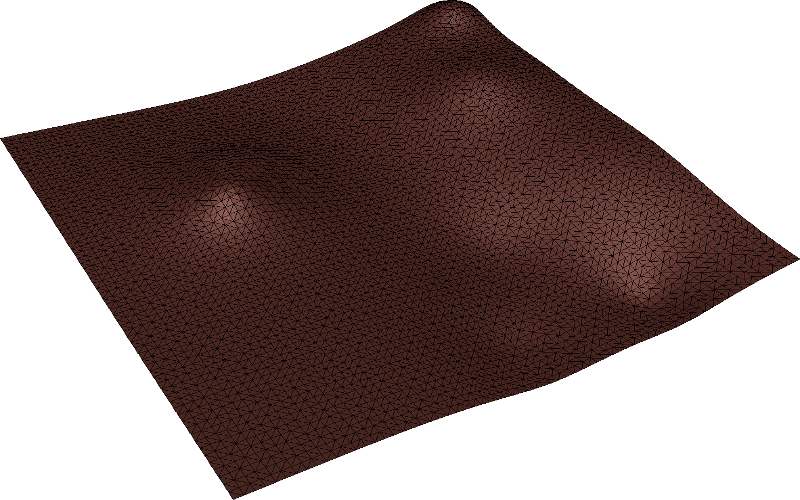
}Generating Random Surfaces
The test data generators work also in Fade2.5D, which provides an additional feature for generating random surfaces. This functionality is also employed, for instance, in the Cut-and-Fill example. For the sake of completeness, let’s review it here:

void randomSurface()
{
    vector<Point2> vRndSurfacePoints;
    generateRandomSurfacePoints(
        70, // numPointsX
        70, // numPointsY
        15, // numCenters
        0,0,-100,1000,1000,100, // Bounds xmin,ymin,zmin,xmax,ymax,zmax
        vRndSurfacePoints,// Output vector
        1// Seed
    );
    Fade_2D dt;
    dt.insert(vRndSurfacePoints);
    dt.showGeomview("randomSurface.list");
}
The function call above creates a 70×70 grid of points within the range (0,0) to (1000,1000) for their x and y coordinates. These points are assigned elevations (z) ranging from -100 to +100. The numCenters parameter controls the surface’s waviness. To visualize the 3D result, you can use functions like showGeomview(), writeObj() or writeWebScene().