In this article, we will achieve two main objectives: first, we’ll explore how to access the elements within a triangulation, and second, we’ll demonstrate how to draw them in Postscript- or PDF format. This visualization is crucial as it enables you to visualize your source code’s outcomes.
Preparing a triangulation
Let’s start by preparing and drawing a simple triangulation for this demonstration in C++:
int example2_main()
{
std::cout<<"\nexample2: Access elements of a triangulation\n";
// * Step 1 * Create points on a circle
std::vector<Point2> vPoints;
int numPoints(6);
double centerX(5),centerY(5),radiusX(5),radiusY(5);
generateCircle( numPoints,centerX,centerY,radiusX,radiusY,vPoints);
vPoints.push_back(Point2(centerX,centerY)); // Add the center point
// * Step 2 * Optional: You can add custom indices to
// relate the points to your own data structures. But you
// do not need to use this feature.
int myStartIndex(77); // An arbitrary value
for(size_t i=0;i<vPoints.size();++i)
{
vPoints[i].setCustomIndex(myStartIndex++);
}
// * Step 3 * Insert the vertices
Fade_2D dt; // The Delaunay triangulation
std::vector<Point2*> vVertexHandles; // Pointers to the vertices inside Fade
dt.insert(vPoints,vVertexHandles); // Fastest method: insert all points at once
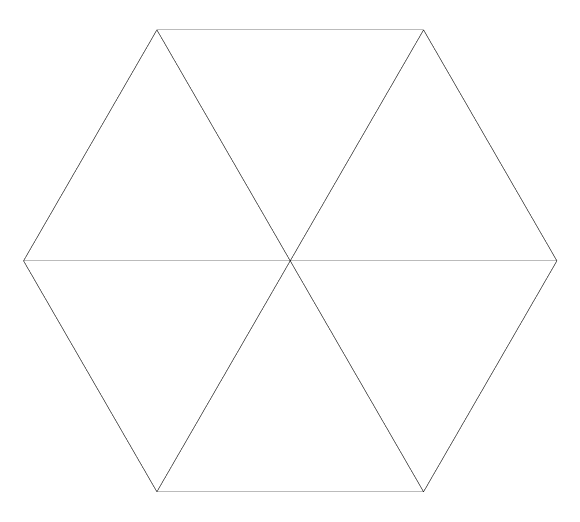
// * 4 * Draw the triangulation
dt.show("triangulation.pdf");
...
}- In Step 1, we create a set of points arranged on a circle, including the center point. We conveniently achieve this using one of Fade2D’s geometry generators.
- Step 2 involves assigning indices to these points. These indices serve the purpose of connecting Fade points with your custom data structures. It’s important to note that this step is entirely optional.
- Step 3 inserts the points. Internally, Fade2D retains a copy of the points and returns pointers to them (in the same order) in
vVertexHandles. Inserting all points at once is the most efficient method, but there is also an option to insert the points one by one. - The fourth step involves drawing the triangulation using
Fade_2D::show("triangulation.pdf")
Until Fade v2.12, the Visualizer2 class was limited to generating Postscript files. With the integration of the excellent PDFGen code in Fade2D version 2.13, Visualizer2 now also supports PDF file generation, offering a more convenient option for Windows users. Simply choose
.psor
Accessing Elements
Access to elements in a triangulation is frequently necessary. For instance, you may need to access the neighboring triangles of a specific triangle or create a custom visualization rather than relying on a pre-existing one. Therefore, let’s explore the manualDraw() function below:
void manualDraw(Fade_2D& dt)
{
// * 1 * Create a postscript/PDF visualizer and define some colors
Visualizer2 vis("manualDraw.pdf");
Color cBlack(CBLACK);
Color cBlue(CBLUE);
Color cRed(CRED);
Color cPurple(CPURPLE);
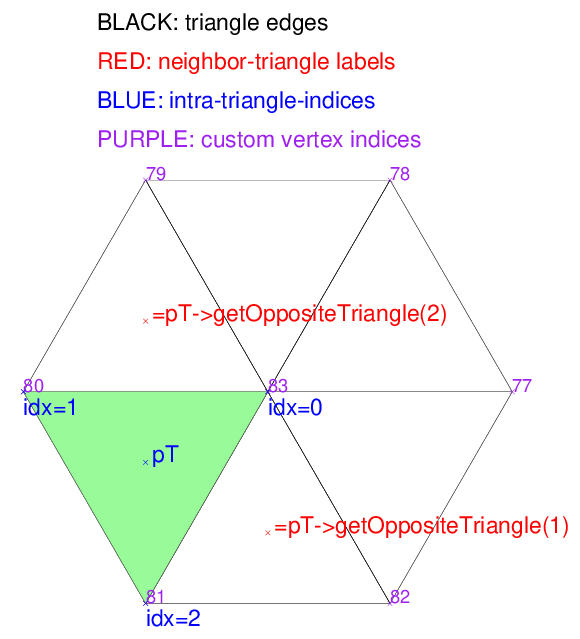
vis.addObject(Label(Point2(1.5,12.4),"BLACK: triangle edges",false,15),cBlack);
vis.addObject(Label(Point2(1.5,11.6),"RED: neighbor-triangle labels",false,15),cRed);
vis.addObject(Label(Point2(1.5,10.8),"BLUE: intra-triangle-indices",false,15),cBlue);
vis.addObject(Label(Point2(1.5,10.0),"PURPLE: custom vertex indices",false,15),cPurple);
// * 2 * Get and draw the vertices with their custom index
std::vector<Point2*> vAllPoints;
dt.getVertexPointers(vAllPoints);
std::cout<<"vAllPoints.size()="<<vAllPoints.size()<<std::endl;
for(std::vector<Point2*>::iterator it(vAllPoints.begin());it!=vAllPoints.end();++it)
{
Point2* currentPoint(*it);
int customIndex(currentPoint->getCustomIndex());
std::string text(toString(customIndex));
vis.addObject(Label(*currentPoint,text.c_str(),true,12),cPurple);
}
// * 3 * Get and draw the triangles
std::vector<Triangle2*> vAllDelaunayTriangles;
dt.getTrianglePointers(vAllDelaunayTriangles);
for(std::vector<Triangle2*>::iterator it=vAllDelaunayTriangles.begin();it!=vAllDelaunayTriangles.end();++it)
{
Triangle2* pT(*it);
vis.addObject(*pT,cBlack);
}
// * 4 * Choose one triangle and color it green
Triangle2* pT(vAllDelaunayTriangles[0]);
Color cGreenFill(CPALEGREEN,0.001f,true);
vis.addObject(*pT,cGreenFill);
// * 5 * The corners of pT can be accessed through the so called intra-
// triangle-indices 0,1,2. They are counterclockwise oriented (CCW).
// Let's write intra-triangle-index labels beside the corners.
for(int intraTriangleIndex=0;intraTriangleIndex<3;++intraTriangleIndex)
{
Point2* pCorner(pT->getCorner(intraTriangleIndex));
std::string text("\nidx="+toString(intraTriangleIndex));
vis.addObject(Label(*pCorner,text.c_str(),true,15),cBlue);
}
// * 6 * Each triangle has three neighbor triangles (or NULL
// pointers at border edges). They are accessed through the
// intra-triangle-indices. The i'th opposite triangle of pT is
// the one that is opposite to the i'th vertex. Let's draw that:
Label label_pT(pT->getBarycenter()," pT",true,15);
vis.addObject(label_pT,cBlue);
for(int intraTriangleIndex=0;intraTriangleIndex<3;++intraTriangleIndex)
{
Triangle2* pNeigT(pT->getOppositeTriangle(intraTriangleIndex));
if(pNeigT==NULL) continue; // No adjacent triangle at this edge
// Compute the barycenter and write a label there
Point2 barycenter(pNeigT->getBarycenter());
std::string text(" =pT->getOppositeTriangle("+toString(intraTriangleIndex)+")");
Label neigLabel(barycenter,text.c_str(),true,15);
vis.addObject(neigLabel,cRed);
}
// Write the PDF to disk
vis.writeFile();
}- Step 1, In this initial step, we create a Visualizer2 object, naming it “manualDraw.pdf” for the PDF file. Following that, we define a set of colors and proceed to incorporate labels into the visualizer.
- Moving on to the second step, we retrieve pointers to all vertices within the triangulation. These vertices are then not only drawn but also annotated by the custom indices that were previously set.
- In the third step we fetch all triangle pointers and add them them to the visualizer.
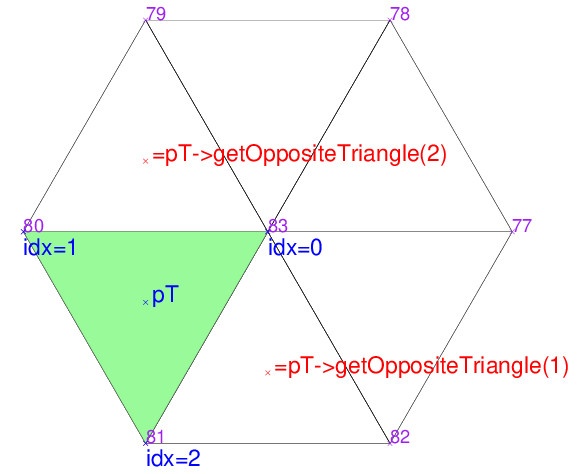
- : In the fourth step, we make a selection of an arbitrary triangle referred to as
pTand fill it with green color. - The fifth step demonstrates how to access the corners of
pTusing intra-triangle indices, denoted by {0, 1, 2}. These indices are consistently ordered counterclockwise and are drawn in blue color in the below image. - Each triangle
pThas three pointers to its neighboring triangles (orNULLin case of border edges): The i-th neighboring triangle is always the one opposite the vertex with intra-triangle-index i. Step 6 draws red labels at the barycenters of the neighbor triangles ofpT. - Finally, we involke the
writeFile()method to finalize the drawing shown below.
More Visualization
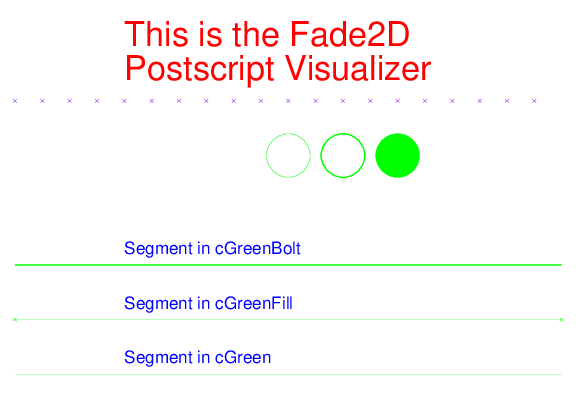
While you may not require it in the immediate future, for the sake of completeness, the source code ex2_access_draw.cpp also incorporates the ‘moreDraw()’ function. This function effectively showcases additional capabilities of the Visualizer2 class. The source code for this function is designed to be self-explanatory, making it an accessible resource for further exploration.
void moreDraw()
{
	// * 1 *   Defining color
	// Define red by values (red,green,blue,linewidth,bFill)
	Color cRed(1,0,0,0.001,false);
	// Or simply use a color name and the defaults linewidth=0.001 and bFill=false
	Color cBlue(CBLUE);
	Color cGreen(CGREEN);
	Color cPurple(CPURPLE);
	// Specify a bolt green color (linewidth=1.0) and another one with
	// bFill=true to fill the area of an object which is drawn using
	// that color. In case that a segment is drawn with bFill=true,
	// marks for its endpoints are added.
	Color cGreenBolt(CGREEN,1.0,false);
	Color cGreenFill(CGREEN,.001f,true);
	// Postscript writer
	Visualizer2 vis("moreDraw.pdf");
	// Create a label and add it to the Visualizer
	Label headLabel(Point2(20,60),	// Position
					"This is the Fade2D\nPostscript Visualizer",
					false,			// Don't write an x-mark
					30);			// Font size
	vis.addObject(headLabel,cRed); 	// Add the label
	// Add a row of points
	for(int x=0;x<100;x+=5)
	{
		Point2 p(x,50);
		vis.addObject(p,cPurple); // Add the point
	}
	// Draw a segment with cGreen
	Point2 p0(0,0);
	Point2 p1(100,0);
	Segment2 seg0(p0,p1);
	vis.addObject(seg0,cGreen); // Add the segment
	// Draw a segment with cGreenFill (with marks at the endpoints)
	Point2 p2(0,10);
	Point2 p3(100,10);
	Segment2 seg1(p2,p3);
	vis.addObject(seg1,cGreenFill); // Add the segment
	// Draw a segment with cGreenBolt
	Point2 p4(0,20);
	Point2 p5(100,20);
	Segment2 seg2(p4,p5);
	vis.addObject(seg2,cGreenBolt); // Add the segment
	// Draw labels
	Label lab0(Point2(20,2),"Segment in cGreen",false,15);
	vis.addObject(lab0,cBlue); // Add the label
	Label lab1(Point2(20,12),"Segment in cGreenFill",false,15);
	vis.addObject(lab1,cBlue); // Add the label
	Label lab2(Point2(20,22),"Segment in cGreenBolt",false,15);
	vis.addObject(lab2,cBlue); // Add the label
	// Add three circles with radius=4 (squared radius 16)
	double sqRadius(4.0*4.0);
	Circle2 circ0(50,40,sqRadius);
	Circle2 circ1(60,40,sqRadius);
	Circle2 circ2(70,40,sqRadius);
	vis.addObject(circ0,cGreen);	// Add the circle
	vis.addObject(circ1,cGreenBolt);// Add the circle
	vis.addObject(circ2,cGreenFill);// Add the circle
	// The postscript file is only written when writeFile() is called.
	vis.writeFile();
}
This covers all you need to know for traversing a Fade triangulation and creating a postscript or PDF visualization of it. Ensure you grasp this example, tinker with the source code, adapt it, and observe the results. If needed, you can refer to the documentation for further guidance. Then proceed to Example3 – Constraint Edges which deals with triangulations involving constraint segments.
2 replies on “Accessing Triangulation Elements and Drawing PDF or Postscript – Example2”
how can I get the triangle indices ?
A triangulation can be iteratively created and modified i.e., triangles appear and disappear dynamically, thus there are no built-in indices for triangles. But you can create indices. Simply add this code at the end of exampes_2D/ex0_helloTriangulation.cpp:
// * 1 * Map triangles to indices vT;
std::vector
dt.getTrianglePointers(vT);
std::map < Triangle2*,int > mT2Idx;
int ctr(0);
for(Triangle2* pT:vT) mT2Idx[pT]=ctr++;
//
// * 2 * Fetch the indices as you need them
for(Triangle2* pT:vT)
{
int idx=mT2Idx[pT];
...
}